|
|
 |
weather.gov | |
 |
 |
||
| Home | NWS News | NWS Organization |
|
|
|
weather.gov | |
|
|
||
| Home | NWS News | NWS Organization |
|
Home >
NDACC Spectral UV Instrument Working Group
>
Long-Term UV Measurements in Polar Regions
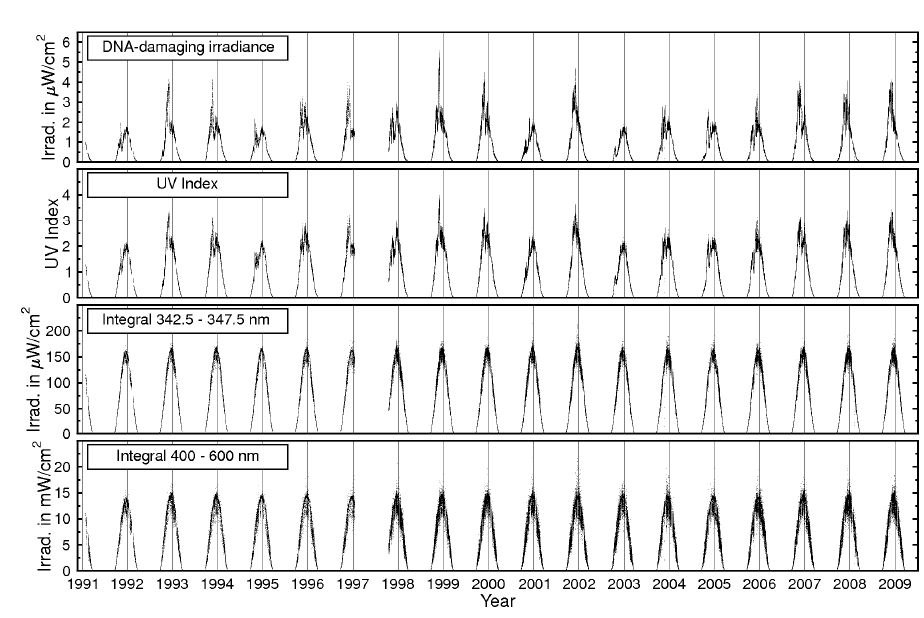
Long-Term UV Measurements in Polar RegionsGermar Bernhard, Biospherical Instruments, San Diego, USA Figure 1 shows time series of DNA-damaging irradiance, UV index, and integrals of 342.5-347.5 and 400-600 nm at the South Pole. Data were measured by a SUV-100 spectroradiometer that is part of the NSF UV Monitoring network, representing a subset of data submitted to the NDACC database. The graph includes measurements between October 1990 and March 2009 and is an extension of a similar dataset published by Bernhard et al. [2004].
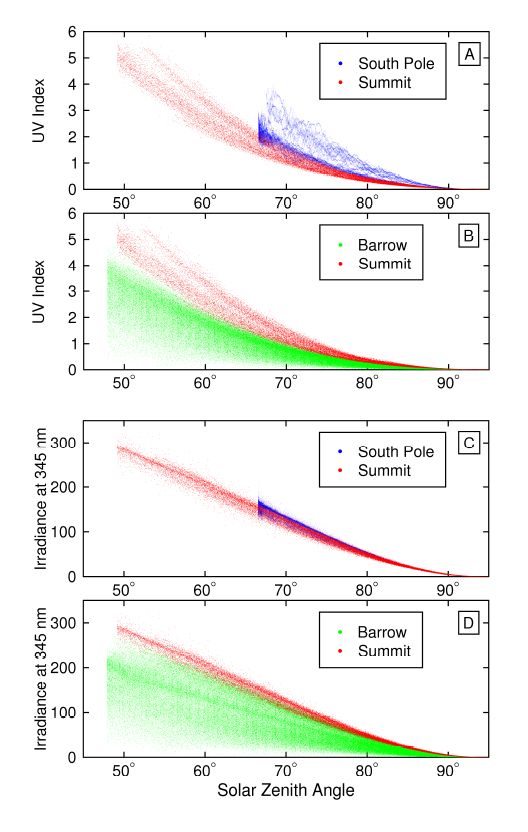
Figure 1. Irradiance time series at South Pole The figure indicates that DNA-damaging irradiance and the UV Index are very sensitive to changes in total ozone: for example, a one percent decrease in total ozone leads to approximately a 2.2% increase in DNA-damaging irradiance. Most of the day-to-day variability of these two data products is due the large variability in total ozone and the impact of the "ozone hole." Largest radiation levels typically occur in late November and early December when low ozone columns coincide with relatively small SZA. Some years such as 1991, 1994, 2000, and 2003 appear to exhibit very little influence from the ozone hole, while other years such as 1992, 1993, 1996, 1998, 1999, 2001, 2006, 2007 and 2008 show a pronounced influence. This impression is somewhat deceptive as some years, such as 2000, displayed large relative enhancements in October when solar elevation and absolute values were still small. Typical summer UV index values range between 2 and 3.5, with a maximum value of 4.0, measured on 11/30/98. Note that these values are significantly smaller than typical summer values for mid-latitudes. However, South Pole has 24 hours of daylight. Daily erythemal doses for the South Pole and San Diego, which were calculated by integrating erythemal irradiance over 24 hours, are therefore comparable. The 342.5-347.5 nm integral is not affected by ozone and the influence by clouds is relatively small, partly because the contribution of the direct beam to global irradiance is less than 34% at all times, and partly because cloud attenuation is moderated by high albedo [Nichol et al., 2003]. As a consequence, the day-to-day and year-to-year variability is very small. The graph suggests that there is less variability for the years 1991-1997 than for years 1998-2009. Until January 1997, spectra were measured hourly, from February 1997 onward, one spectrum was measured every 15 min. The perception of larger scatter is not due to a real increase in variability but is apparent due to the four-times-higher sampling in the later years. The 400-600 nm integral is more affected by cloud attenuation than the 342.5-347.5 nm integral, which explains the higher variability. Although ozone also absorbs weakly in the visible (Chappuis band), the contribution from changes in absorption in the Chappuis band to the overall variability is negligible. Figure 2 compares measurements of spectral irradiance integrated over the range of 342.5-347.5 nm (hereinafter called "irradiance at 345 nm") and the UV Index as a function of SZA for the three sites, namely the South Pole; Summit, Greenland; and Barrow, Alaska.
Figure 2. Comparison between sites and wavelengths of the SZA dependencies of measured irradiances. Upper panels (UV Index). Lower panels, UVA (345 nm) The following can be concluded from the measurements at 345 nm:
The following can be concluded from measurements of the UV Index:
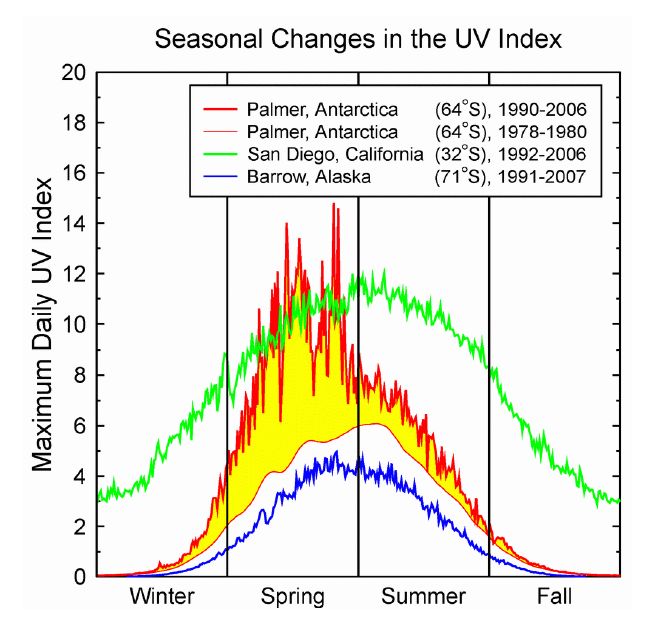
Figure 3 compares the maximum daily UV Index ever measured at Palmer Station, Antarctica, San Diego, and Barrow, Alaska. The maximum daily UV Index is a measure of peak sunburning UV that occurs during the day at a particular location. For Palmer Station, the figure also shows an estimate of the annual cycle of the UV index for the time period of 1978-1980, i.e. before development of the ozone hole. This data set is based on model calculations taking into account satellite ozone measurements and assumption on the annual cycles of surface albedo and attenuation by clouds. The figure shows that the UV Index is higher in San Diego than in Barrow throughout the year. Index values are zero at high latitudes when darkness is continuous. The effect of ozone depletion on the Index is demonstrated by comparing the Palmer and San Diego data. Normal values estimated for Palmer are shown for the 1978-1980 period before the “ozone hole” occurred each season (thin red line). In the last two decades (1990-2006), Antarctic ozone depletion has led to an increase in the maximum UV Index value at Palmer throughout spring (see yellow shaded region). Values at Palmer are now sometimes equal or exceed those measured in spring in San Diego, which is located at a much lower latitude.
Figure 3. Seasonal, geographical, and temporal variations in maximum daily UV Index at NSF sites. Bernhard, G., C. R. Booth, and J. C. Ehramjian. (2004). Version 2 data of the National Science Foundation's Ultraviolet Radiation Monitoring Network: South Pole, J. Geophys. Res., 109, D21207, doi:10.1029/2004JD004937. Nichol, S.E., G. Pfister, G.E. Bodeker, R.L. McKenzie, S.W. Wood, and G. Bernhard. (2003). Moderation Of Cloud Reduction Of UV in the Antarctic due to High Surface Albedo. J. Appl. Meteorol., 42(8), 1174-1183.
|
|||||||||||||||||||